|
A Gauss gun has a strong magnet and a number of steel spheres that are attracted to the magnet and can move on a track. We will assume that our magnet and track are attached to a heavy table and the combination doesn’t move significantly. This means we can ignore momentum conservation since the heavy table can carry away excess momentum without it moving observably. All our motions are horizontal so we ignore gravity.
If a sphere is put within a few inches of the magnet it sticks to the magnet. We can describe the interaction of the spheres with the magnet in terms of a potential energy, U. Take the energy of a sphere to be 0 when it is at rest and far from the magnet. Three situations, A, B, and C, are shown at the right. We describe position in our system using the x coordinate shown with the zero taken to be in the center of the magnet.
|
 |
| A. If you try to pull the sphere away from the magnet in case A, you will find that it is held by a strong attractive force that gets weaker as the sphere gets farther from the magnet. A force is no longer detectable once you are more than 30 cm away. On the graph at the right sketch the potential energy of the sphere-magnet system as a function of x where x represents the position of Sphere 1. Your graph should correctly represent the qualitative features of the interaction. |
 |
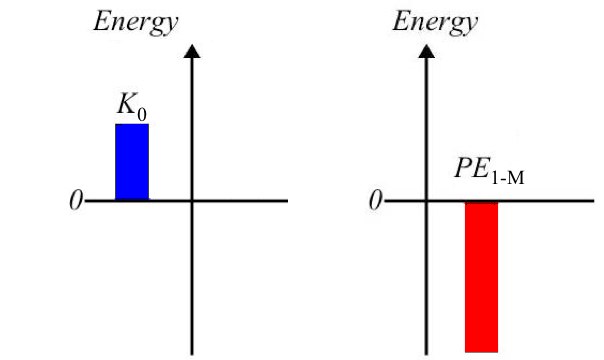 |
At the left is shown a different kind of representation – an energy bar chart. This identifies various components of the energy of each object shown at its location by a bar. The vertical energy axis represents the position of the magnet. The leftmost chart represents sphere 0 moving on the left of the magnet and shows its KE. The chart at the right represents the potential energy of sphere 1 and the magnet (shown attached to the position of sphere 1). So the left bar might represent the KE of sphere 0 in situation C, while the right one represents the PE of the magnet and sphere 1 in situations A, B, or C.
|
| B. In situation B, sphere 3 is fairly easy to remove from the complex, sphere 2 harder, and sphere 1 very difficult. On a chart like the one at the right, assuming that everything is stationary (and ignoring any possible potential energies from interactions between the spheres themselves) draw bars representing the various energies (for each sphere) in situation B. |
|
C. In situation C, sphere 0 is released about 30 cm from the magnet with a small KE. It slowly speeds up until it slams into the magnet going fast and sticks to the magnet. As a result, sphere 3 flies off to the right at a high speed. In the charts below, draw bar charts representing the energies in the initial state and after the collision when sphere 3 is moving away at a distance of 30 cm. Draw your diagrams carefully to represent any important relations among the energies. Explain what considerations you used to draw your diagrams.

D. To see how this works, choose arbitrary numbers like integers to represent teach of the energies -- ignoring units. For example we might call the blue KE bar in the figure at the left of part A, "4", and the red PE bar in the figure as "-10". Use your numbers to write the total energy in the initial situation and the total energy in the final situation, choosing numbers that both represent the relative scale of the bars you drew and add up correctly to show energy conservation.
Now answer the question: In this reaction a particle came in at a low kinetic energy and another went out at a high kinetic energy. Where did the extra energy come from?
Joe Redish and Dave Buehrle 4/17/14
Comments (0)
You don't have permission to comment on this page.